plot.svpredict and plot.svlpredict generate some plots
visualizing the posterior predictive distribution of future volatilites and
future observations.
Arguments
Value
Called for its side effects. Returns argument x invisibly.
Note
Note that svpredict or svlpredict objects can also be
used within plot.svdraws for a possibly more useful
visualization. See the examples in predict.svdraws and
those below for use cases.
See also
Other plotting:
paradensplot(),
paratraceplot(),
paratraceplot.svdraws(),
plot.svdraws(),
volplot()
Other plotting:
paradensplot(),
paratraceplot(),
paratraceplot.svdraws(),
plot.svdraws(),
volplot()
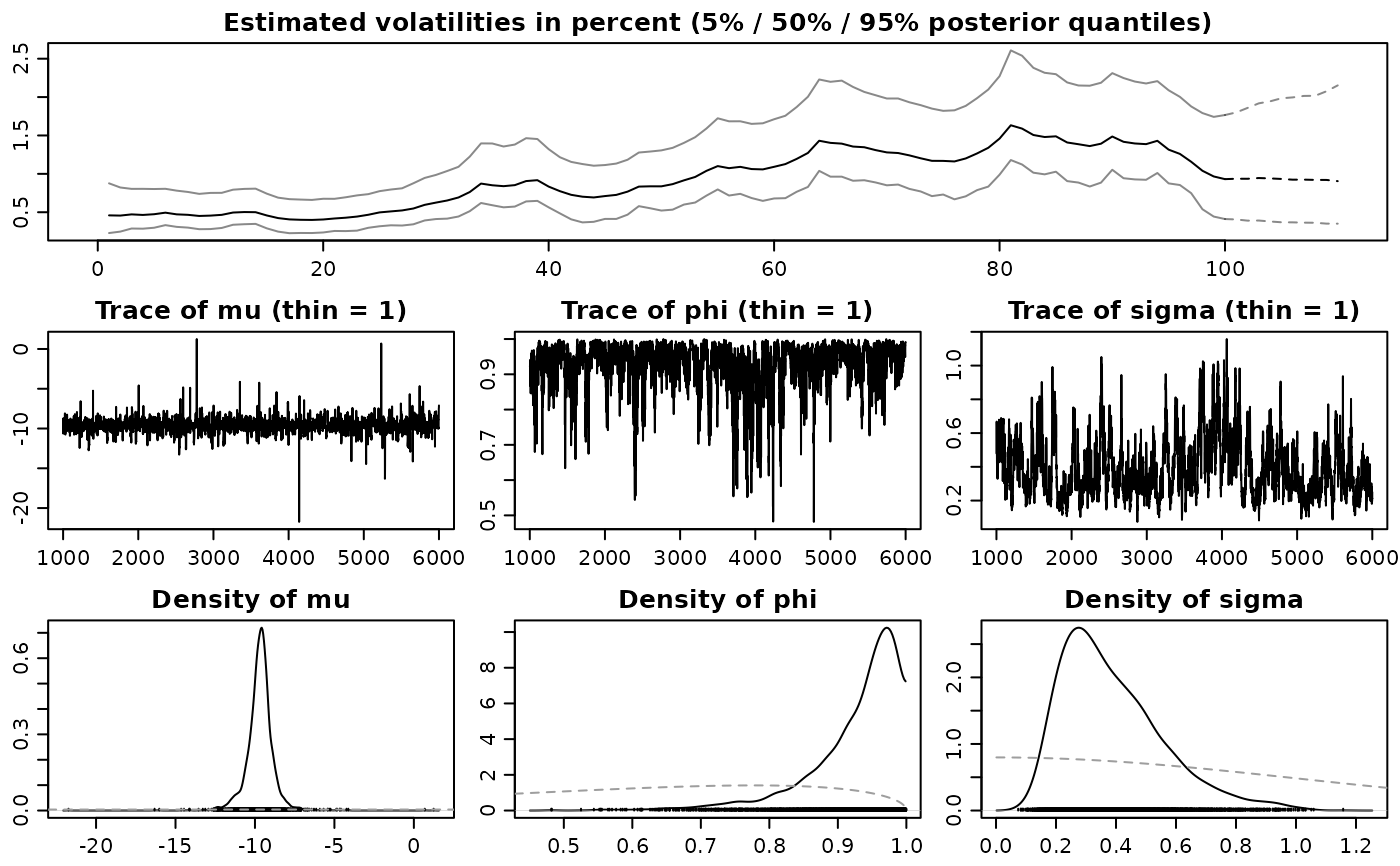
Examples
## Simulate a short and highly persistent SV process
sim <- svsim(100, mu = -10, phi = 0.99, sigma = 0.1)

## Obtain 5000 draws from the sampler (that's not a lot)
draws <- svsample(sim$y, draws = 5000, burnin = 1000)
#> Done!
#> Summarizing posterior draws...

## Predict 10 steps ahead
pred <- predict(draws, 10)

## Visualize the predicted distributions
plot(pred)


## Plot the latent volatilities and some forecasts
plot(draws, forecast = pred)
## Plot the latent volatilities and some forecasts
plot(draws, forecast = pred)